Monitoring & Operations
Queue Configuration Management
Updating Queue Mappings
To update queue mappings in a running environment:
-
Edit the ConfigMap in the gap folder:
# Edit the configuration file in your repository vim gap/gap_configmap_queue_config.yaml -
Apply the updated ConfigMap:
kubectl apply -f gap/gap_config_queue_config.yaml -
Restart the pods to pick up the new configuration:
kubectl rollout restart deployment me-pubsub-delayer-task-creator -n mobile-engage -
Verify the new configuration in the logs:
kubectl logs -l app=me-pubsub-delayer-task-creator -n mobile-engage | grep "validating-queues"
Creating a New Cloud Task Queue
When adding a new queue to the configuration:
-
Create the queue in Google Cloud Tasks:
gcloud tasks queues create pubsub-delayer-new-queue \ --location=europe-west3 \ --project=ems-mobile-engage \ --max-dispatches-per-second=500 \ --max-concurrent-dispatches=100 -
Verify the queue was created:
gcloud tasks queues describe pubsub-delayer-new-queue \ --location=europe-west3 \ --project=ems-mobile-engage -
Update the ConfigMap to include the new queue mapping (see above).
Troubleshooting Queue Configuration
Service Fails to Start
If the service fails to start after a configuration change, check:
-
Queue names: Ensure all queues exist in Google Cloud Tasks
-
YAML syntax: Validate YAML formatting (use a YAML validator)
-
ConfigMap mount: Verify the ConfigMap is properly mounted
View startup logs:
kubectl logs -l app=me-pubsub-delayer-task-creator -n mobile-engage --tail=100Common errors:
-
queue validation failed: A queue referenced in the config doesn’t exist -
failed to parse YAML: Syntax error in the configuration file -
default queue cannot be empty: Missing requireddefaultfield
Messages Going to Wrong Queue
Check the queue selection logs:
kubectl logs -l app=me-pubsub-delayer-task-creator -n mobile-engage | \
  grep "queue-selected-for-topic"
This will show which pattern matched for each topic. Remember: first match wins.
To identify which topics are using a specific queue:
kubectl logs -l app=me-pubsub-delayer-task-creator -n mobile-engage | \
  grep "queue-selected-for-topic" | \
  jq -r 'select(.queue=="pubsub-delayer-analytics") | .topic' | \
  sort | uniq
Monitoring
The Google Cloud Task service offers several possibilities to monitor and also control what happens.
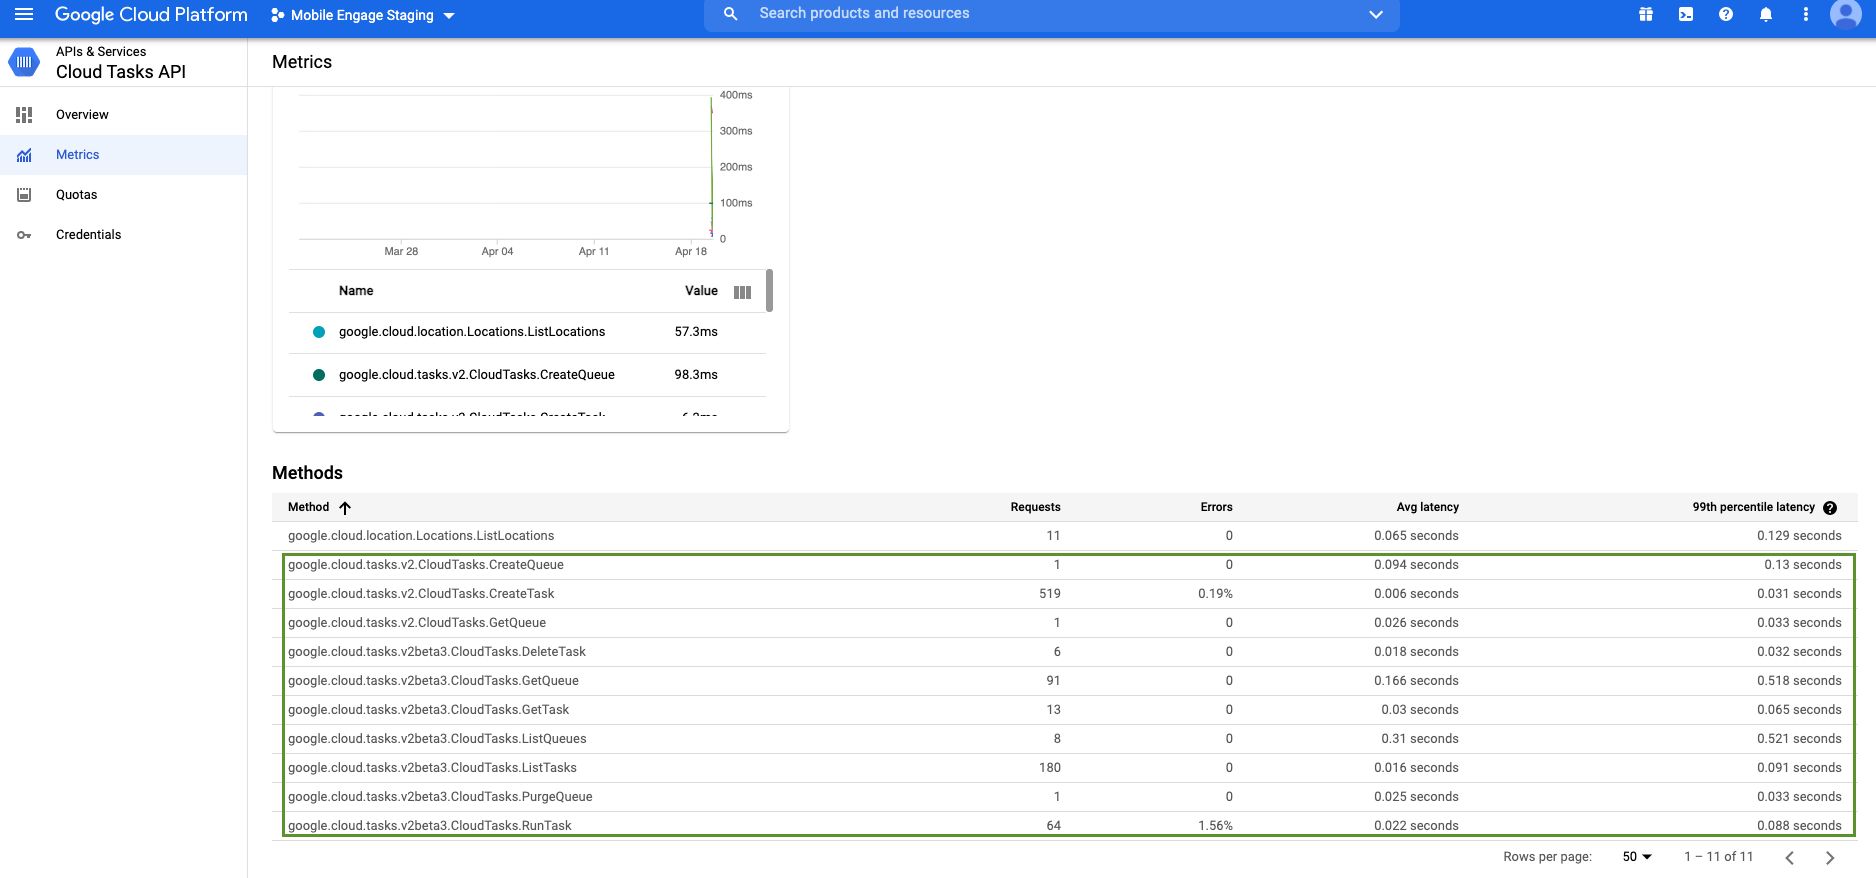
The Cloud Tasks API UI gives a good overview about the current status, the requests the service received and the latencies.
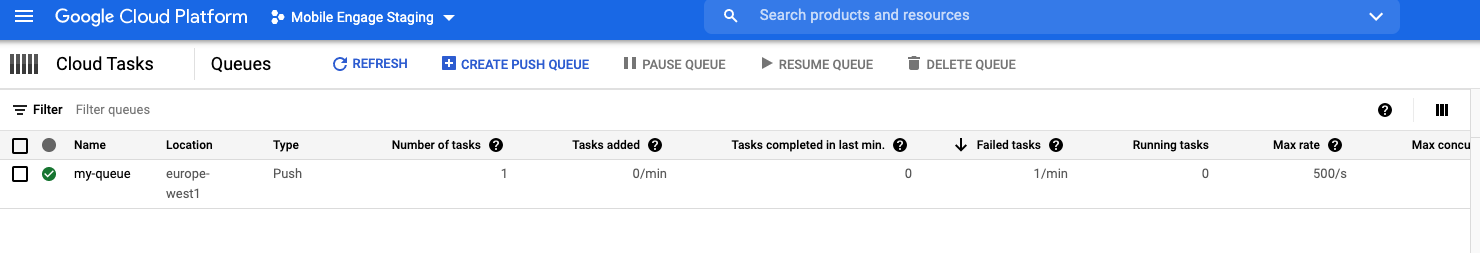
Beside that the Cloud Tasks UI, shows a list of available task queues. It gives a basic overview…
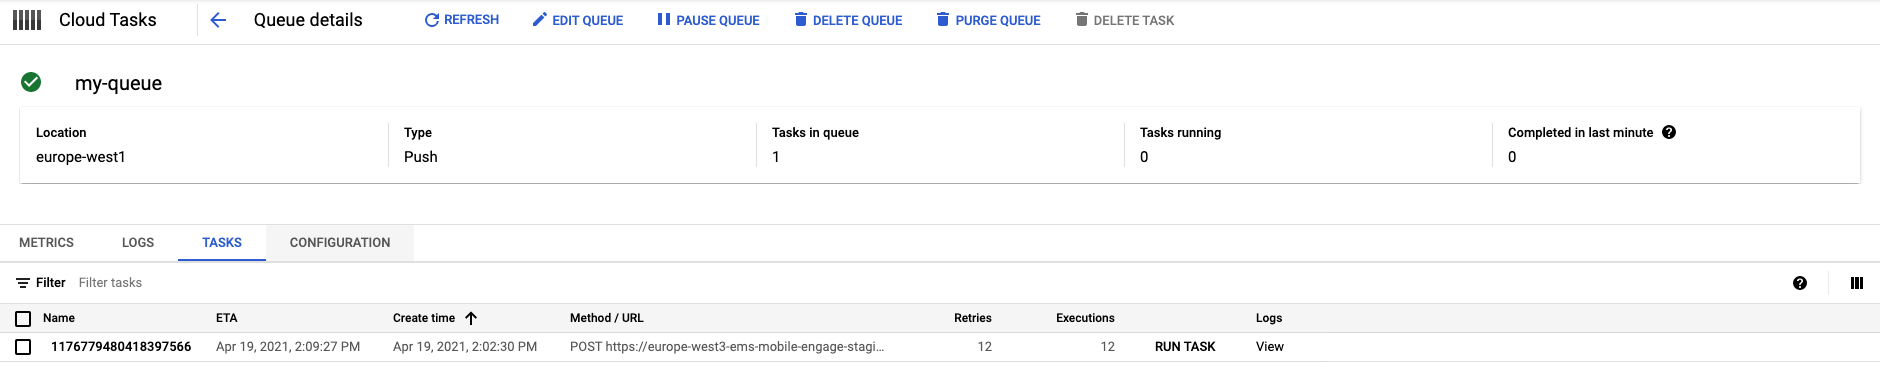
…and in the queue details (so if you click on a queue on the main page) there are very similar options for task queues as we have in Pub/Sub. You can see in the following image, that there are options to
-
see information about the
Metrics, -
list the logs,
-
configure the queue itself including stopping it and/or purging the tasks and
-
check the currently queued tasks and immediately trigger one by simply clicking on
Run Task.
It is also possible to check the logs which are related to a single task, if you click on the View
entry beside the related task.
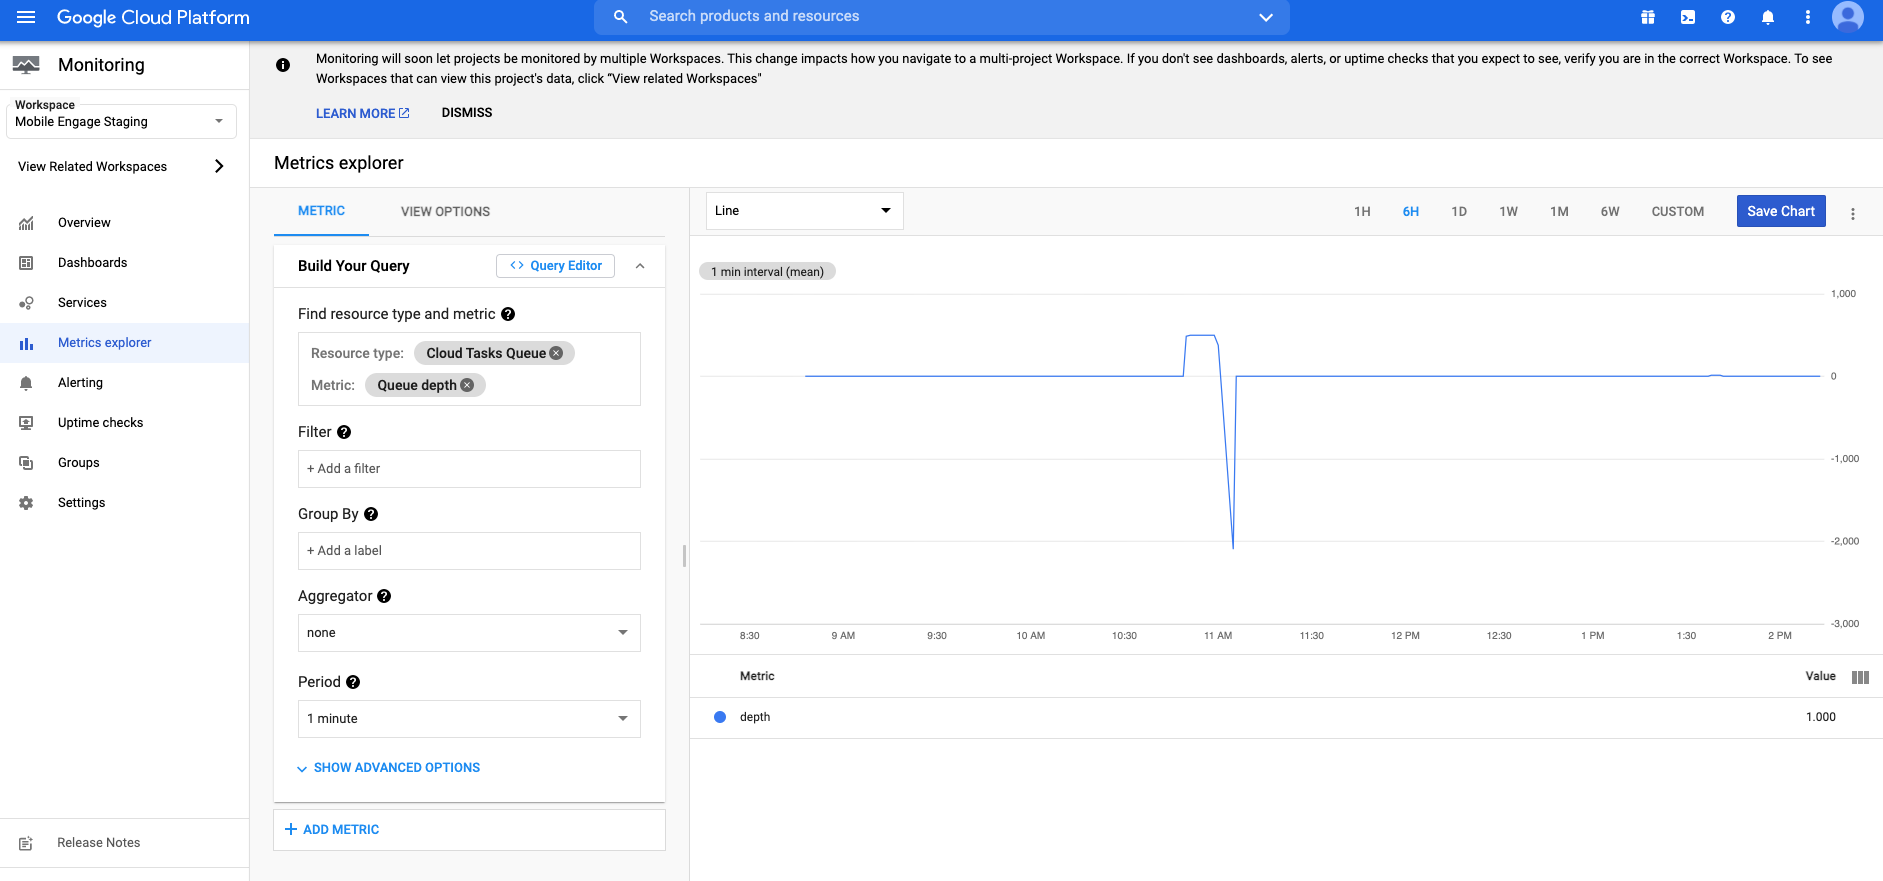
And finally there is Stackdriver which can be used to show all metrics and if desired can be used to set up alarms:
Monitoring Queue Routing
Per-Queue Metrics
Monitor each queue independently in the Cloud Console to understand load distribution:
-
Task creation rate: Number of tasks created per queue
-
Task execution rate: Number of tasks executed per queue
-
Queue depth: Number of pending tasks in each queue
-
Task age: How long tasks wait before execution
These metrics help you identify hot queues and optimize configuration.
Queue Selection Analytics
View queue distribution across all messages:
kubectl logs -l app=me-pubsub-delayer-task-creator -n mobile-engage | \
  grep "queue-selected-for-topic" | \
  jq -r '.queue' | \
  sort | uniq -c | sort -rn

# Example output:
#  1247 pubsub-delayer
#   823 pubsub-delayer-client-changes
#   456 pubsub-delayer-analytics
Production
kubectl edit configmap me-pubsub-delayer-queue-config -n mobile-engage
Staging
kubectl edit configmap me-pubsub-delayer-queue-config -n mobile-engage
2. After updating the ConfigMap, restart the pods to pick up the new configuration:
+
[source,bash]
kubectl rollout restart deployment me-pubsub-delayer-task-creator -n mobile-engage
3. Verify the new configuration in the logs:
+
[source,bash]
kubectl logs -l app=me-pubsub-delayer-task-creator -n mobile-engage | grep "validating-queues"
=== Adding a New Queue

To add a new queue mapping:

1. Create the queue in Google Cloud Tasks:
+
[source,bash]
gcloud tasks queues create my-new-queue \ --location=europe-west3 \ --project=ems-mobile-engage
2. Update the ConfigMap with the new mapping:
+
[source,yaml]
mappings: my-topic: my-new-queue # … other mappings
3. Restart the service to validate and use the new queue.

=== Troubleshooting Queue Configuration

==== Service Fails to Start

If the service fails to start after a configuration change, check:

* *Queue names*: Ensure all queues exist in Google Cloud Tasks
* *YAML syntax*: Validate YAML formatting (use a YAML validator)
* *ConfigMap mount*: Verify the ConfigMap is properly mounted

View startup logs:
[source,bash]
kubectl logs -l app=me-pubsub-delayer-task-creator -n mobile-engage --tail=100
Common errors:

* `queue validation failed`: A queue referenced in the config doesn't exist
* `failed to parse YAML`: Syntax error in the configuration file
* `default queue cannot be empty`: Missing required `default` field

==== Messages Going to Wrong Queue

Check the queue selection logs:

[source,bash]
kubectl logs -l app=me-pubsub-delayer-task-creator -n mobile-engage | grep "queue-selected-for-topic"
This will show which pattern matched for each topic. Remember: *first match wins*.

== Monitoring

The Google Cloud Task service offers several possibilities to monitor and also control what
happens.

The link:https://console.cloud.google.com/apis/api/cloudtasks.googleapis.com/metrics?project=ems-mobile-engage-staging[Cloud Tasks API UI]
gives a good overview about the current status, the requests the service received and the latencies.

image::cloud-tasks-api-overview.png[Cloud Tasks API UI]

Beside that the https://console.cloud.google.com/cloudtasks?project=ems-mobile-engage-staging[Cloud Tasks UI],
shows a list of available task queues. It gives a basic overview...

image::cloud-tasks-main-overview.png[Cloud Tasks UI Main]

...and in the queue details (so if you click on a queue on the main page) there are very similar
options for task queues as we have in Pub/Sub. You can see in the following image, that there are options to

* see information about the `Metrics`,
* list the logs,
* configure the queue itself including stopping it and/or purging the tasks and
* check the currently queued tasks and immediately trigger one by simply clicking on `Run Task`.

It is also possible to check the logs which are related to a single task, if you click on the `View`
entry beside the related task.

image::cloud-tasks-ui-details.png[Cloud Tasks UI Details]

And finally there is link:https://console.cloud.google.com/monitoring?project=ems-mobile-engage-staging&timeDomain=1h[Stackdriver]
which can be used to show all metrics and if desired can be used to set up alarms:

image::cloud-tasks-stack-driver.png[Cloud Tasks Stackdriver]

=== Key Metrics to Monitor

==== Per-Queue Metrics

Monitor each queue independently to understand load distribution:

* *Task creation rate*: Number of tasks created per queue
* *Task execution rate*: Number of tasks executed per queue
* *Queue depth*: Number of pending tasks in each queue
* *Task age*: How long tasks wait before execution

These metrics help you:

* Identify hot queues that may need higher throughput
* Detect queues that are backing up
* Optimize queue configuration based on actual traffic patterns

==== Queue Selection Logs

Monitor logs for queue routing decisions:

[source,bash]
See which queues are being used
kubectl logs -l app=me-pubsub-delayer-task-creator -n mobile-engage | \ grep "queue-selected-for-topic" | \ jq -r '.queue' | \ sort | uniq -c | sort -rn